Geopolitics and Oil Prices
The conflict in Iran and the disruption to shipping through the Strait of Hormuz became the dominant market story of the first quarter. Brent crude oil surged to $118 per barrel, an increase of approximately 94% year-to-date, while WTI crude rose above $100. These developments reverberated across global energy markets and contributed meaningfully to the quarter’s overall volatility.
Gasoline prices climbed to roughly $4 per gallon, raising concerns about the impact on consumer spending. However, economists broadly view the current supply shock as temporary. The 2022 precedent is instructive: gasoline prices reached $5 per gallon that summer before falling significantly within a matter of months as supply chains adjusted.
History shows that geopolitical events, while unsettling, do not typically derail markets over the long term. Investors who made dramatic portfolio changes in response to past geopolitical crises often did so at precisely the wrong moment, locking in losses rather than participating in the subsequent recovery.
Economic Growth Is Slowing but Remains Positive
February payrolls fell by 92,000, and the unemployment rate edged up to 4.4%. The number of job seekers now exceeds the number of job openings, a shift from the historically tight labor markets of recent years. While these data points signal a cooling economy, they should be interpreted in the proper context.
Lower immigration levels and an aging population are cooling both the supply of and demand for labor. At the same time, consumer spending, which accounts for roughly two-thirds of GDP, has remained stronger than expected. The economy is slowing, but the fundamentals that support continued growth remain intact.
Sector Performance Has Diverged
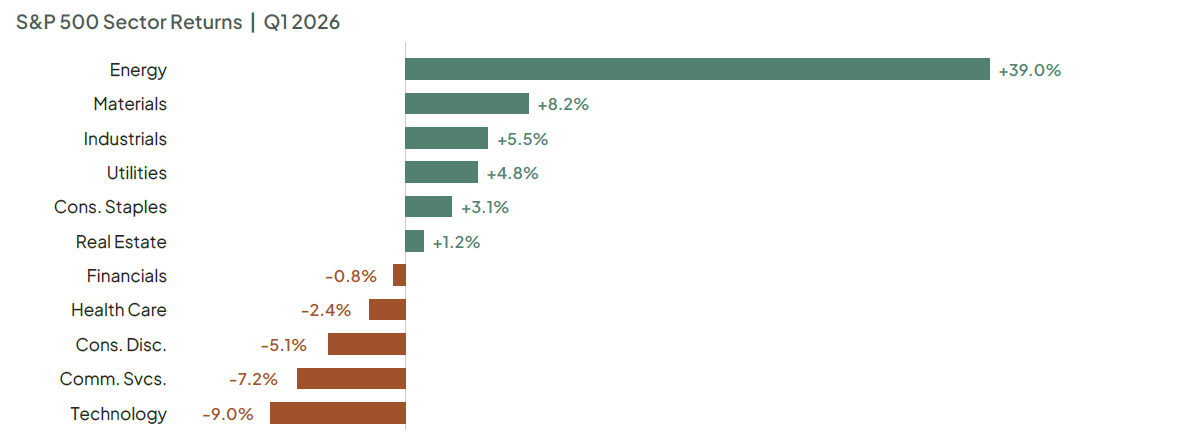
One of the defining characteristics of the first quarter was the wide dispersion in sector performance. Six of the eleven S&P 500 sectors posted positive returns, and the spread between the best- and worst-performing sectors was approximately 50 percentage points.
Energy was the clear leader, gaining roughly 40% as oil prices surged. Consumer Staples, Utilities, Materials, and Industrials also finished in positive territory, reflecting a rotation into more defensive and commodity-linked areas of the market.
Technology declined approximately 9%, and the so-called Magnificent 7 stocks underperformed the broader market — a notable shift from recent years in which these names drove the majority of index returns. This type of leadership change is a reminder that a balanced, diversified portfolio is positioned to weather different market environments.
The Tariff Story Is Evolving
In a significant legal development, the Supreme Court ruled 6-3 that tariffs imposed under the International Emergency Economic Powers Act (IEEPA) were unlawful. In response, the administration imposed temporary duties under Section 122 of the Trade Act of 1974, while Section 301 and Section 232 investigations remain ongoing.
The key takeaway for investors is that trade policy continues to evolve, and markets are adjusting accordingly. While headline risk remains, history suggests that markets adapt over time to shifts in trade policy. The most productive course of action for long-term investors is to remain invested and maintain a diversified portfolio.
Looking Ahead
The coming months bring a number of additional questions for markets to consider, including a change in Federal Reserve leadership, upcoming midterm elections, and ongoing fiscal policy debates. Each of these developments has the potential to introduce new sources of volatility, but none of them change the fundamental principles of long-term investing.
Markets have demonstrated resilience over time. Well-balanced portfolios and comprehensive financial plans can help provide stability and keep long-term goals in focus, even during periods of uncertainty.
We encourage all of our clients to continue focusing on their long-term financial objectives. Your Vertex team remains focused on your plan, your goals, and the disciplined approach that has helped guide your financial strategy through many different market environments.
As always, we remain committed to monitoring markets, managing risk, and keeping your financial plan on track. If you have questions about your portfolio or financial plan, please do not hesitate to reach out to your Vertex advisor.

First Quarter 2026 Market Summary
The first quarter of 2026 illustrates the importance of preparation when it comes to financial planning and investing. After strong gains in 2025, markets faced a combination of geopolitical shocks, higher oil prices, and renewed economic uncertainty. The conflict in Iran became the dominant market story, pushing oil prices sharply higher and sparking the first pullback of the year. For long-term investors, the quarter is a reminder that markets rarely move in a straight line, and that the principles of sound investing matter most when uncertainty is at its peak.
-4.3%
S&P 500
Q1 Total Return
+93%
Brent Crude
Q1 Price Change
+14 bps
10-Yr Treasury
Q1 Yield Change
Key Market and Economic Drivers
Category
Q1 2026
S&P 500 Total Return
-4.3%
Nasdaq Total Return
-7.0%
Dow Jones Industrial Average
-3.2%
Bloomberg US Agg Bond Index
Flat
10-Year Treasury Yield
+14 bps
MSCI EAFE (Developed Int’l)
-1.1%
MSCI EM (Emerging Markets)
-0.1%
Brent Crude Oil
+93% ($118/bbl)
WTI Crude Oil
$101/bbl
Gold
$4,668/oz
US Dollar Index (DXY)
99.96
CPI (YoY, February)
2.4%
Core CPI (YoY, February)
2.5%
Core PCE (YoY, January)
3.1%
Fed Funds Rate
3.50% – 3.75%
Markets Experienced the First Pullback of the Year
It is natural to draw parallels between the start of this year and the beginning of 2025, since both were driven by global concerns. Both first quarter periods experienced pullbacks for the S&P 500 of 4.3%. While last year’s volatility was the result of tariffs and this year’s is due to the conflict in the Middle East, the effect on investor sentiment has been similar. When uncertainty rises, it is natural for markets to experience short-term swings in response to headlines.
The past is no guarantee of the future, but zooming out can help us understand how markets have behaved historically. Despite the challenges in the first quarter of 2025, the stock market experienced strong gains through the remainder of the year, including dozens of record highs across major indices.
Perhaps the most helpful perspective is to remember that pullbacks are a normal and unavoidable part of investing. Since 1980, the S&P 500 has experienced an average intra-year drawdown of around 15%, even though markets tend to experience positive returns in more than two-thirds of years.
Portfolios aligned with long-term financial goals are designed exactly to navigate these periods.
Geopolitics and Oil Prices
The conflict in Iran and the disruption to shipping through the Strait of Hormuz became the dominant market story of the first quarter. Brent crude oil surged to $118 per barrel, an increase of approximately 94% year-to-date, while WTI crude rose above $100. These developments reverberated across global energy markets and contributed meaningfully to the quarter’s overall volatility.
Gasoline prices climbed to roughly $4 per gallon, raising concerns about the impact on consumer spending. However, economists broadly view the current supply shock as temporary. The 2022 precedent is instructive: gasoline prices reached $5 per gallon that summer before falling significantly within a matter of months as supply chains adjusted.
History shows that geopolitical events, while unsettling, do not typically derail markets over the long term. Investors who made dramatic portfolio changes in response to past geopolitical crises often did so at precisely the wrong moment, locking in losses rather than participating in the subsequent recovery.
Economic Growth Is Slowing but Remains Positive
February payrolls fell by 92,000, and the unemployment rate edged up to 4.4%. The number of job seekers now exceeds the number of job openings, a shift from the historically tight labor markets of recent years. While these data points signal a cooling economy, they should be interpreted in the proper context.
Lower immigration levels and an aging population are cooling both the supply of and demand for labor. At the same time, consumer spending, which accounts for roughly two-thirds of GDP, has remained stronger than expected. The economy is slowing, but the fundamentals that support continued growth remain intact.
Sector Performance Has Diverged
One of the defining characteristics of the first quarter was the wide dispersion in sector performance. Six of the eleven S&P 500 sectors posted positive returns, and the spread between the best- and worst-performing sectors was approximately 50 percentage points.
Energy was the clear leader, gaining roughly 40% as oil prices surged. Consumer Staples, Utilities, Materials, and Industrials also finished in positive territory, reflecting a rotation into more defensive and commodity-linked areas of the market.
Technology declined approximately 9%, and the so-called Magnificent 7 stocks underperformed the broader market — a notable shift from recent years in which these names drove the majority of index returns. This type of leadership change is a reminder that a balanced, diversified portfolio is positioned to weather different market environments.
The Tariff Story Is Evolving
In a significant legal development, the Supreme Court ruled 6-3 that tariffs imposed under the International Emergency Economic Powers Act (IEEPA) were unlawful. In response, the administration imposed temporary duties under Section 122 of the Trade Act of 1974, while Section 301 and Section 232 investigations remain ongoing.
The key takeaway for investors is that trade policy continues to evolve, and markets are adjusting accordingly. While headline risk remains, history suggests that markets adapt over time to shifts in trade policy. The most productive course of action for long-term investors is to remain invested and maintain a diversified portfolio.
Looking Ahead
The coming months bring a number of additional questions for markets to consider, including a change in Federal Reserve leadership, upcoming midterm elections, and ongoing fiscal policy debates. Each of these developments has the potential to introduce new sources of volatility, but none of them change the fundamental principles of long-term investing.
Markets have demonstrated resilience over time. Well-balanced portfolios and comprehensive financial plans can help provide stability and keep long-term goals in focus, even during periods of uncertainty.
We encourage all of our clients to continue focusing on their long-term financial objectives. Your Vertex team remains focused on your plan, your goals, and the disciplined approach that has helped guide your financial strategy through many different market environments.
As always, we remain committed to monitoring markets, managing risk, and keeping your financial plan on track. If you have questions about your portfolio or financial plan, please do not hesitate to reach out to your Vertex advisor.
Christopher Huston
Chief Investment Officer
Vertex Planning Partners
Sean Baloun
Portfolio Manager
Vertex Planning Partners
This material is provided for informational and educational purposes only and should not be construed as investment, legal, or tax advice for any specific individual or situation. Statements regarding market trends, asset classes, sector leadership, interest rates, inflation, and geopolitical developments are based on publicly available information as of March 31, 2026, and are subject to change without notice. Past performance does not guarantee future results. Diversification, asset allocation, and rebalancing do not ensure a profit or protect against loss in declining markets. Third-party market data and commentary were drawn from sources including Reuters and BlackRock Investment Institute. These sources are believed to be reliable, but accuracy and completeness cannot be guaranteed.
Index Definitions
S&P 500 Index
A market-capitalization-weighted index of 500 leading publicly traded companies in the United States, widely regarded as the best single gauge of large-cap U.S. equities. Maintained by S&P Dow Jones Indices.
Nasdaq Composite Index
A market-capitalization-weighted index comprising virtually all stocks listed on the Nasdaq Stock Market, with a significant weighting toward information technology companies. Maintained by Nasdaq, Inc.
Dow Jones Industrial Average (DJIA)
A price-weighted index of 30 large, blue-chip U.S. companies selected by the editors of The Wall Street Journal to represent the broad
U.S. economy. Maintained by S&P Dow Jones Indices.
Bloomberg US Aggregate Bond Index
A broad-based, market-capitalization-weighted benchmark measuring the performance of the U.S. investment-grade, fixed-rate, taxable bond market, including Treasuries, government-related and corporate securities, and mortgage-backed securities.
MSCI EAFE Index
A stock market index measuring the equity performance of large- and mid-cap companies across 21 developed markets in Europe, Australasia, and the Far East, excluding the U.S. and Canada. Maintained by MSCI Inc.
MSCI Emerging Markets Index
A market-capitalization-weighted index measuring large- and mid-cap equity performance across 24 emerging market countries. Maintained by MSCI Inc.
US Dollar Index (DXY)
An index measuring the value of the U.S. dollar relative to a basket of six major foreign currencies: the euro, Japanese yen, British pound, Canadian dollar, Swedish krona, and Swiss franc. Originally developed by the Federal Reserve in 1973.
Consumer Price Index (CPI)
A measure of the average change over time in the prices paid by urban consumers for a market basket of consumer goods and services. Published monthly by the U.S. Bureau of Labor Statistics.
Personal Consumption Expenditures Price Index (Core PCE)
A measure of consumer inflation that excludes food and energy prices, published by the U.S. Bureau of Economic Analysis. The Federal Reserve’s preferred gauge of underlying inflation.
Data Sources
Share This: